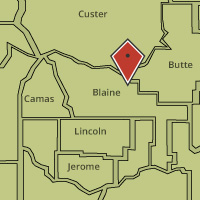
Census dashboard
Tableau Key
Filter data from lowest to highest
Filter data from highest to lowest
Download this interactive chart as an Excel file, data set, static image or Tableau workbook (Tableau software needed).
View selected data from graphs as a table
Local employment dynamics

Idaho local area dynamics
Create custom employment reports based on age, gender and geographic location.

On the Map
Create your own custom maps and reports. On The Map is an interactive mapping application that shows in high definition where people live and where they work.